


Fact Sheets
2024 Medicare Advantage and Part D Star Ratings
Note: The information included in this Fact Sheet is based on the 2024 Star Ratings published on the Medicare Plan Finder on October 13, 2023. For details on the Medicare Advantage (MA) and Part D Star Ratings, please refer to the 2024 Part C & D Star Ratings Technical Notes available at http://go.cms.gov/partcanddstarratings.
Introduction
The Centers for Medicare & Medicaid Services (CMS) publishes the Medicare Advantage (Medicare Part C) and Medicare Part D Star Ratings each year to measure the quality of health and drug services received by consumers enrolled in Medicare Advantage (MA) and Prescription Drug Plans (PDPs or Part D plans). The Star Ratings system helps Medicare consumers compare the quality of Medicare health and drug plans being offered so they are empowered to make the best health care decisions for them. An important component of this effort is to provide Medicare consumers and their caregivers with meaningful information about quality alongside information about benefits and costs to assist them in being informed and active health care consumers.
Highlights of Contract Performance in 2024 Star Ratings
Changes in the Methodology for the 2024 Star Ratings
Medicare Advantage with prescription drug (Part D) coverage (MA-PD) contracts are rated on up to 40 unique quality and performance measures; MA-only contracts (without Part D coverage) are rated on up to 30 measures; and PDP contracts are rated on up to 12 measures. As finalized in previous rulemaking, the updated Plan All-Cause Readmissions (Part C) measure [1] was re-specified and transitioned off the display page into the 2024 Star Ratings as a new measure with a weight of 1 for the first year. Starting with the 2024 Star Ratings, the Diabetes Care – Kidney Disease Monitoring (Part C) measure [2] was retired, and both the Transitions of Care (Part C) and Follow-Up after Emergency Department Visit for People with Multiple High-Risk Chronic Conditions (Part C) measures [3] were added to the 2024 Star Ratings, each with a weight of 1. The weight for the Part C Controlling Blood Pressure measure was increased from 1 to 3 [4].
As finalized in rulemaking in 2020, the 2024 Star Ratings introduced Tukey outlier deletion [5] when calculating the cut points for all non-Consumer Assessment of Healthcare Providers and Systems (CAHPS) measures in order to improve predictability and stability in the Star Ratings. Tukey outlier deletion involves removing outlier contract scores prior to applying mean resampling within the hierarchical clustering algorithm to determine measure-level cut points.
Data integrity issues are now included in the description of missing data [6] in the extreme and uncontrollable circumstance (disaster) policy. For disaster-affected contracts with a data integrity issue, the final measure rating is based on the current year.
Rating Distribution [7]
The last row in Table 1 shows the trend in the average overall Star Ratings weighted by enrollment for MA-PDs from 2021 to 2024 after any adjustments for extreme and uncontrollable circumstances. [10] The change in distribution from 2023 to 2024 Star Ratings is influenced by changes in measure scores in both positive and negative directions based on contract performance and the introduction of Tukey outlier deletion as well as the addition of two new Part C measures (Transitions of Care and Follow-Up after Emergency Department Visit for People with Multiple High-Risk Chronic Conditions), adding back the Plan All-Cause Readmissions (Part C) measure after a substantive change in the measure specification, and retiring the Diabetes Care – Kidney Disease Monitoring (Part C) measure.
- Approximately 42% of MA-PDs (229 contracts) that will be offered in 2024 earned 4 stars or higher for their 2024 overall rating.
- Weighted by enrollment, approximately 74% of MA-PD enrollees are currently in contracts that will have 4 or more stars in 2024.
Table 1: 2021 - 2024 Overall Star Rating Distribution for MA-PD Contracts
|
Overall Rating |
2021 |
2022 |
2023 |
2024 |
||||||||
|
# of Contracts |
% |
Weighted by Enrollment |
# of Contracts |
% |
Weighted by Enrollment |
# of Contracts |
% |
Weighted by Enrollment |
# of Contracts |
% |
Weighted by Enrollment |
|
|
5 stars |
21 |
5.25 |
9.15 |
74 |
15.71 |
26.59 |
57 |
11.24 |
21.87 |
31 |
5.69 |
6.96 |
|
4.5 stars |
63 |
15.75 |
21.92 |
96 |
20.38 |
33.21 |
67 |
13.21 |
25.92 |
75 |
13.76 |
30.90 |
|
4 stars |
110 |
27.50 |
45.76 |
152 |
32.27 |
29.87 |
136 |
26.82 |
24.26 |
123 |
22.57 |
35.86 |
|
3.5 stars |
141 |
35.25 |
18.97 |
122 |
25.90 |
8.49 |
116 |
22.88 |
18.71 |
138 |
25.32 |
17.79 |
|
3 stars |
61 |
15.25 |
4.14 |
25 |
5.31 |
1.80 |
90 |
17.75 |
6.73 |
128 |
23.49 |
7.05 |
|
2.5 stars |
4 |
1.00 |
0.06 |
2 |
0.42 |
0.03 |
37 |
7.30 |
2.39 |
46 |
8.44 |
1.41 |
|
2 stars |
0 |
0 |
0 |
0 |
0 |
0 |
4 |
0.79 |
0.12 |
4 |
0.73 |
0.03 |
|
Total Rated Contracts |
400 |
100 |
|
471 |
100 |
|
507 |
100 |
|
545 |
100 |
|
|
Average Star Rating* |
4.06 |
4.37 |
4.14 |
4.04 |
||||||||
* The average Star Rating is weighted by enrollment.
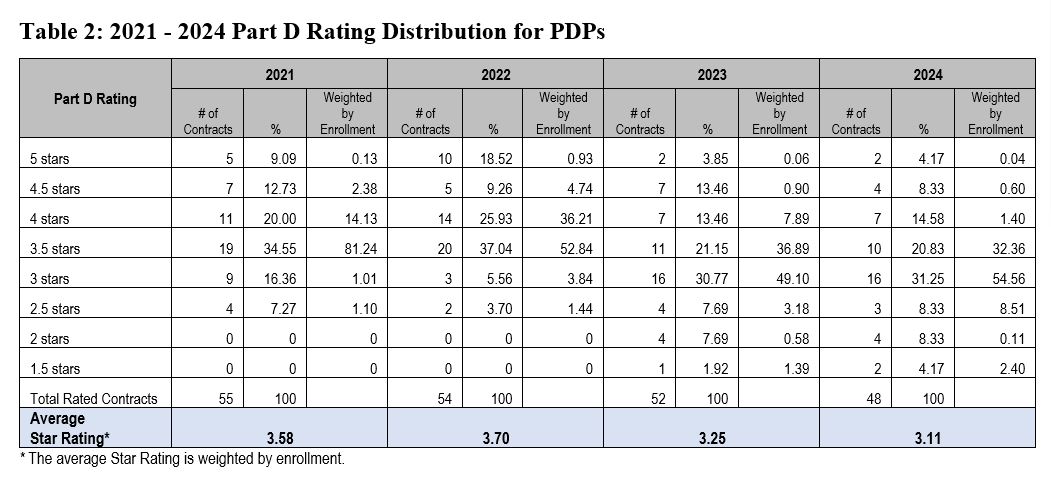
The last row in Table 2 shows the average Part D Ratings weighted by enrollment for stand-alone PDPs from 2021 to 2024 after any adjustments for extreme and uncontrollable circumstances. [10]
-
Approximately 27% of PDPs (13 contracts) that will be active in 2024 received 4 or more stars for their 2024 Part D Rating.
-
Weighted by enrollment, about 2 percent of PDP enrollees are currently in contracts that will have 4 or more stars in 2024.
|
|
5-Star Contracts
A total of 36 contracts are highlighted on the Medicare Plan Finder with a high performing icon [8] indicating they earned 5 stars; 31 are MA-PD contracts (Table A1 in Appendix), three are 1876 Cost Contracts (Table A2 in Appendix), and two are PDPs (Table A3 in Appendix). For 2024, 11 contracts receiving the high performing icon did not receive it in 2023.
Consistently Low Performers
There are six contracts identified on the Medicare Plan Finder with a low performing icon [9] for 2024 for consistently low quality ratings (Table A4 in Appendix). Last year, one contract received this icon.
Tax Status and Performance
Organizations that are non-profit more frequently earn higher ratings than organizations that are for-profit. For MA-PDs, approximately 56% of non-profit contracts received 4 or more stars compared to 36% of for-profit MA-PDs. Similarly, for PDPs, approximately 50% of non-profit PDPs received 4 or more stars compared to 14% of for-profit PDPs.
Below is the ratings distribution by tax status for MA-PD (Table 3) and PDP (Table 4) contracts after any adjustments for extreme and uncontrollable circumstances. [10]
Table 3: Distribution of 2024 Overall Star Ratings for For-profit and Non-profit MA-PDs
|
2024 Overall Rating |
Count For-Profit |
% For-Profit |
Weighted By Enrollment For-Profit |
Count Non-Profit |
% Non-Profit |
Weighted By Enrollment Non-Profit |
|
5 stars |
25 |
6.41 |
8.07 |
6 |
3.87 |
3.37 |
|
4.5 stars |
35 |
8.97 |
32.46 |
40 |
25.81 |
25.84 |
|
4 stars |
82 |
21.03 |
32.54 |
41 |
26.45 |
46.64 |
|
3.5 stars |
96 |
24.62 |
17.34 |
42 |
27.10 |
19.26 |
|
3 stars |
106 |
27.18 |
7.84 |
22 |
14.19 |
4.47 |
|
2.5 stars |
42 |
10.77 |
1.72 |
4 |
2.58 |
0.41 |
|
2 stars |
4 |
1.03 |
0.03 |
0 |
0 |
0 |
|
Total Rated Contracts |
340 |
|
|
155 |
|
|
Table 4: Distribution of 2024 Part D Ratings for For-profit and Non-profit PDPs
|
2024 Part D Rating |
Count For-Profit |
% For-Profit |
Weighted By Enrollment For-Profit |
Count Non-Profit |
% Non-Profit |
Weighted By Enrollment Non-Profit |
|
5 stars |
0 |
0 |
0 |
2 |
11.11 |
1.64 |
|
4.5 stars |
0 |
0 |
0 |
4 |
22.22 |
22.96 |
|
4 stars |
4 |
13.79 |
0.60 |
3 |
16.67 |
31.18 |
|
3.5 stars |
7 |
24.14 |
33.19 |
3 |
16.67 |
11.63 |
|
3 stars |
10 |
34.48 |
54.85 |
5 |
27.78 |
30.57 |
|
2.5 stars |
3 |
10.34 |
8.81 |
0 |
0 |
0 |
|
2 stars |
3 |
10.34 |
0.06 |
1 |
5.56 |
2.01 |
|
1.5 stars |
2 |
6.90 |
2.49 |
0 |
0 |
0 |
|
Total Rated Contracts |
29 |
|
|
18 |
|
|
Length of Time in Program and Performance
Generally, higher overall Star Ratings are associated with contracts that have more experience in the MA program. MA-PDs with 10 or more years in the program are more likely to have 4 or more stars compared to contracts with less than 5 years in the program. For PDPs, the relationship is similar in that PDPs with 10 or more years in the program do better in the Star Ratings relative to contracts with less than 5 years experience. There are only three PDPs that have at least 5 years but less than 10 years of experience and two of the three received 4 or more stars. The tables below show the distribution of ratings by the number of years in the program (MA-PDs are shown in Table 5 and PDPs in Table 6 after adjustments for extreme and uncontrollable circumstances). [10]
Table 5: Distribution of 2024 Overall Star Ratings by Length of Time in Program for MA-PDs
|
2024 Overall Rating |
Number of Contracts with less than 5 Years |
% Less than 5 Years |
Number of Contracts with 5 years to Less than 10 Years |
% 5 Years to Less than 10 Years |
Number of Contracts with 10 or More Years |
% 10 or More Years |
|
5 stars |
6 |
3.53 |
3 |
2.86 |
22 |
8.15 |
|
4.5 stars |
16 |
9.41 |
11 |
10.48 |
48 |
17.78 |
|
4 stars |
24 |
14.12 |
27 |
25.71 |
72 |
26.67 |
|
3.5 stars |
43 |
25.29 |
28 |
26.67 |
67 |
24.81 |
|
3 stars |
50 |
29.41 |
31 |
29.52 |
47 |
17.41 |
|
2.5 stars |
28 |
16.47 |
4 |
3.81 |
14 |
5.19 |
|
2 stars |
3 |
1.76 |
1 |
0.95 |
0 |
0 |
|
Total Rated Contracts |
170 |
|
105 |
|
270 |
|
Table 6: Distribution of 2024 Part D Ratings by Length of Time in Program for PDPs
|
2024 Part D Rating |
Number of Contracts with less than 5 Years |
% Less than 5 Years |
Number of Contracts with 5 years to Less than 10 Years |
% 5 Years to Less than 10 Years |
Number of Contracts with 10 or More Years |
% 10 or More Years |
|
5 stars |
0 |
0 |
1 |
33.33 |
1 |
2.38 |
|
4.5 stars |
0 |
0 |
0 |
0 |
4 |
9.52 |
|
4 stars |
0 |
0 |
1 |
33.33 |
6 |
14.29 |
|
3.5 stars |
1 |
33.33 |
0 |
0 |
9 |
21.43 |
|
3 stars |
0 |
0 |
0 |
0 |
16 |
38.10 |
|
2.5 stars |
0 |
0 |
0 |
0 |
3 |
7.14 |
|
2 stars |
0 |
0 |
1 |
33.33 |
3 |
7.14 |
|
1.5 stars |
2 |
66.67 |
0 |
0 |
0 |
0 |
|
Total Rated Contracts |
3 |
3 |
42 |
Average Star Rating for Each Measure
Below we list the average Star Ratings for 2021, 2022, 2023, and 2024 Part C and D measures (Tables 7, 8, and 9) using all measure scores for contracts that are publicly reported in a given year. All Star Ratings referenced in Tables 7, 8, and 9 are after adjustments for extreme and uncontrollable circumstances triggered by the COVID-19 public health emergency (PHE) for the 2022 Star Ratings for non-Health Outcomes Survey (HOS) measures and for the 2023 Star Ratings for HOS measures, and after adjustments for other qualifying extreme and uncontrollable circumstances [10] for the 2022 performance period have been applied.
Table 7: 2021 - 2024 Average Star Rating by Part C Measure
|
Measure |
2021 Average Star |
2022 Average Star |
2023 Average Star |
2024 Average Star |
|
Breast Cancer Screening |
3.5 |
3.9 |
3.7 |
3.7 |
|
Colorectal Cancer Screening |
3.9 |
3.9 |
3.8 |
3.7 |
|
Annual Flu Vaccine |
3.2 |
3.4 |
3.2 |
3.1 |
|
Monitoring Physical Activity |
3.5 |
3.1 |
3.2 |
3.0 |
|
Special Needs Plan (SNP) Care Management |
3.4 |
3.6 |
3.3 |
3.4 |
|
Care for Older Adults – Medication Review |
4.3 |
4.4 |
4.4 |
3.8 |
|
Care for Older Adults – Pain Assessment |
4.5 |
4.4 |
4.3 |
3.9 |
|
Osteoporosis Management in Women who had a Fracture |
3.1 |
3.1 |
2.6 |
2.6 |
|
Diabetes Care – Eye Exam |
3.8 |
3.8 |
3.7 |
3.5 |
|
Diabetes Care – Blood Sugar Controlled |
4.2 |
4.3 |
4.1 |
3.6 |
|
Controlling Blood Pressure |
NA |
NA |
3.5 |
3.4 |
|
Reducing the Risk of Falling |
3.0 |
2.5 |
2.9 |
2.9 |
|
Improving Bladder Control |
3.2 |
2.7 |
3.3 |
3.2 |
|
Medication Reconciliation Post-Discharge |
3.0 |
3.5 |
3.4 |
3.4 |
|
Plan All-Cause Readmissions |
NA |
NA |
NA |
2.9 |
|
Statin Therapy for Patients with Cardiovascular Disease |
3.1 |
3.5 |
3.5 |
3.3 |
|
Transitions of Care |
NA |
NA |
NA |
2.5 |
|
Follow-up after Emergency Department Visit for People with Multiple High-Risk Chronic Conditions |
NA |
NA |
NA |
3.0 |
|
Getting Needed Care |
3.3 |
3.6 |
3.4 |
3.4 |
|
Getting Appointments and Care Quickly |
3.4 |
3.6 |
3.5 |
3.5 |
|
Customer Service |
3.5 |
3.8 |
3.4 |
3.6 |
|
Rating of Health Care Quality |
3.3 |
3.6 |
3.4 |
3.3 |
|
Rating of Health Plan |
3.2 |
3.5 |
3.2 |
3.1 |
|
Care Coordination |
3.4 |
3.7 |
3.5 |
3.6 |
|
Complaints about the Plan |
4.8 |
4.7 |
4.3 |
3.9 |
|
Members Choosing to Leave the Plan |
4.0 |
4.1 |
3.5 |
3.6 |
|
Health Plan Quality Improvement |
3.2 |
3.7 |
2.6 |
3.0 |
|
Plan Makes Timely Decisions about Appeals |
4.3 |
4.6 |
4.6. |
4.1 |
|
Reviewing Appeals Decisions |
4.5 |
4.6 |
4.4 |
3.6 |
|
Call Center – Foreign Language Interpreter and TTY Availability |
4.3 |
4.6 |
4.3 |
4.3 |
Table 8: 2021 - 2024 Average Star Rating by Part D Measure for MA-PDs
|
Measure |
2021 MA-PD Average Star |
2022 MA-PD Average Star |
2023 MA-PD Average Star |
2024 MA-PD Average Star |
|
Call Center – Foreign Language Interpreter and TTY Availability |
4.4 |
4.5 |
4.4 |
3.7 |
|
Complaints about the Plan |
4.8 |
4.7 |
4.3 |
3.9 |
|
Members Choosing to Leave the Plan |
4.0 |
4.1 |
3.5 |
3.6 |
|
Drug Plan Quality Improvement |
3.5 |
4.2 |
2.7 |
3.4 |
|
Rating of Drug Plan |
3.0 |
3.4 |
3.2 |
3.2 |
|
Getting Needed Prescription Drugs |
3.5 |
3.8 |
3.4 |
3.5 |
|
MPF Price Accuracy |
4.9 |
4.0 |
4.2 |
3.6 |
|
Medication Adherence for Diabetes Medications |
3.7 |
3.7 |
3.0 |
3.3 |
|
Medication Adherence for Hypertension (RAS antagonists) |
3.2 |
3.9 |
3.4 |
3.4 |
|
Medication Adherence for Cholesterol (Statins) |
3.3 |
3.6 |
3.1 |
3.2 |
|
MTM Program Completion Rate for CMR |
3.7 |
4.0 |
3.9 |
3.5 |
|
Statin Use in Persons with Diabetes (SUPD) |
3.1 |
3.4 |
3.1 |
2.7 |
Table 9: 2021 - 2024 Average Star Rating by Part D Measure for PDPs
|
Measure |
2021 PDP Average Star |
2022 PDP Average Star |
2023 PDP Average Star |
2024 PDP Average Star |
|
Call Center – Foreign Language Interpreter and TTY Availability |
4.2 |
4.2 |
4.1 |
3.0 |
|
Complaints about the Plan |
4.9 |
4.8 |
4.4 |
3.9 |
|
Members Choosing to Leave the Plan |
4.1 |
4.2 |
4.0 |
3.8 |
|
Drug Plan Quality Improvement |
4.1 |
4.1 |
2.2 |
2.9 |
|
Rating of Drug Plan |
3.5 |
3.8 |
3.3 |
3.4 |
|
Getting Needed Prescription Drugs |
3.6 |
3.9 |
3.5 |
3.5 |
|
MPF Price Accuracy |
4.9 |
3.3 |
3.5 |
3.6 |
|
Medication Adherence for Diabetes Medications |
3.9 |
3.9 |
2.9 |
2.6 |
|
Medication Adherence for Hypertension (RAS antagonists) |
3.1 |
3.5 |
2.7 |
2.6 |
|
Medication Adherence for Cholesterol (Statins) |
3.6 |
3.6 |
3.1 |
3.0 |
|
MTM Program Completion Rate for CMR |
3.6 |
3.7 |
3.1 |
3.2 |
|
Statin Use in Persons with Diabetes (SUPD) |
3.0 |
3.3 |
2.9 |
2.4 |
APPENDIX
Table A1: MA-PD Contracts Receiving the 2024 High Performing Icon
|
Contract ID |
Contract Name |
Parent Organization |
9/2023 Enrollment |
5 Star Last Year |
Includes SNP Plan Benefit Packages |
|
H0154 |
VIVA HEALTH, INC. |
Triton Health Systems, L.L.C. |
54,211 |
Yes |
Yes |
|
H0169 |
UNITEDHEALTHCARE OF WISCONSIN, INC. |
UnitedHealth Group, Inc. |
90,554 |
No |
Yes |
|
H0292 |
HUMANA HEALTH PLAN OF OHIO, INC. |
Humana Inc. |
10,217 |
Yes |
No |
|
H0332 |
KS PLAN ADMINISTRATORS, LLC |
UnitedHealth Group, Inc. |
49,331 |
Yes |
No |
|
H0710 |
CARE IMPROVEMENT PLUS SOUTH CENTRAL INSURANCE CO. |
UnitedHealth Group, Inc. |
49,125 |
Yes |
Yes |
|
H1036 |
HUMANA MEDICAL PLAN, INC. |
Humana Inc. |
602,593 |
No |
Yes |
|
H1290 |
DEVOTED HEALTH PLAN OF FLORIDA, INC. |
Devoted Health, Inc. |
35,402 |
No |
Yes |
|
H1537 |
CARE IMPROVEMENT PLUS SOUTH CENTRAL INSURANCE CO. |
UnitedHealth Group, Inc. |
8,965 |
Yes |
No |
|
H1961 |
PEOPLES HEALTH, INC. |
UnitedHealth Group, Inc. |
97,472 |
Yes |
Yes |
|
H1994 |
SELECTHEALTH, INC. |
Intermountain Health Care, Inc. |
47,705 |
Yes |
Yes |
|
H2292 |
CARE IMPROVEMENT PLUS SOUTH CENTRAL INSURANCE CO. |
UnitedHealth Group, Inc. |
9,608 |
Yes |
Yes |
|
H2610 |
ESSENCE HEALTHCARE, INC. |
Lumeris Group Holdings Corporation |
55,027 |
Yes |
No |
|
H2697 |
DEVOTED HEALTH PLAN OF OHIO, INC. |
Devoted Health, Inc. |
22,137 |
Yes |
Yes |
|
H3344 |
INDEPENDENT HEALTH BENEFITS CORPORATION |
Independent Health Association, Inc. |
4,943 |
Yes |
No |
|
H3362 |
INDEPENDENT HEALTH ASSOCIATION, INC. |
Independent Health Association, Inc. |
61,341 |
Yes |
Yes |
|
H3664 |
AULTCARE HEALTH INSURING CORPORATION |
Aultman Health Foundation |
14,078 |
Yes |
No |
|
H3907 |
UPMC HEALTH PLAN, INC. |
UPMC Health System |
148,511 |
Yes |
No |
|
H3957 |
HIGHMARK CHOICE COMPANY |
Highmark Health |
58,410 |
Yes |
No |
|
H4172 |
NHC ADVANTAGE, LLC |
Missouri Healthcare Advisors, LLC |
1,200 |
No |
Yes |
|
H4286 |
LEON HEALTH, INC. |
Leon Health Holdings, LLC |
39,137 |
No |
Yes |
|
H4461 |
CARITEN HEALTH PLAN INC. |
Humana Inc. |
166,542 |
Yes |
Yes |
|
H5215 |
NETWORK HEALTH INSURANCE CORPORATION |
Network Health, Inc. |
69,727 |
Yes |
Yes |
|
H5420 |
Preferred Care Network, Inc. |
UnitedHealth Group, Inc. |
39,879 |
No |
Yes |
|
H5471 |
SIMPLY HEALTHCARE PLANS, INC. |
Elevance Health, Inc. |
60,723 |
No |
Yes |
|
H5533 |
UPMC HEALTH NETWORK, INC. |
UPMC Health System |
18,950 |
Yes |
No |
|
H5577 |
MCS ADVANTAGE, INC. |
MHH Healthcare, L.P. |
207,906 |
No |
Yes |
|
H5594 |
OPTIMUM HEALTHCARE, INC. |
Elevance Health, Inc. |
59,431 |
Yes |
Yes |
|
H5652 |
SIERRA HEALTH AND LIFE INSURANCE COMPANY, INC. |
UnitedHealth Group, Inc. |
6,007 |
Yes |
Yes |
|
H7617 |
EMPHESYS INSURANCE COMPANY |
Humana Inc. |
10,662 |
No |
No |
|
H9153 |
WEST VIRGINIA SENIOR ADVANTAGE, INC. |
SNP Holdings, LLC |
852 |
No |
Yes |
|
H9834 |
QUARTZ HEALTH PLAN MN CORPORATION |
University of Wisconsin Hospitals and Clincs Autho |
3,598 |
Yes |
No |
Table A2: 1876 Cost Contracts Receiving the 2024 High Performing Icon*
|
Contract ID |
Contract Name |
Parent Organization |
9/2023 Enrollment |
5 Star Last Year |
|
H1651 |
MEDICAL ASSOCIATES HEALTH PLAN, INC. |
Medical Associates Clinic, P.C. |
15,046 |
Yes |
|
H5256 |
MEDICAL ASSOCIATES CLINIC HEALTH PLAN |
Medical Associates Clinic, P.C. |
3,728 |
Yes |
|
H5264 |
DEAN HEALTH PLAN, INC. |
Medica Holding Company |
13,409 |
Yes |
*1876 Cost Contracts do not offer SNPs
Table A3: PDP Contracts Receiving the 2024 High Performing Icon
|
Contract ID |
Contract Name |
Parent Organization |
9/2023 Enrollment |
5 Star Last Year |
|
S1822 |
HEALTHPARTNERS, INC. |
HealthPartners, Inc. |
2,404 |
No |
|
S4501 |
INDEPENDENT HEALTH BENEFITS CORPORATION |
Independent Health Association, Inc. |
7,268 |
Yes |
Table A4: Contracts Receiving the Low Performing Icon for the 2024 Star Ratings
|
Contract ID |
Contract Name |
Parent Organization |
Reason for Low Performance Warning |
9/2023 Enrollment |
|
H0724 |
BUCKEYE HEALTH PLAN COMMUNITY SOLUTIONS, Inc. |
Centene Corporation |
Part C or D |
1,900 |
|
H5199 |
WELLCARE HEALTH INSURANCE OF ARIZONA, INC. |
Centene Corporation |
Part C |
9,808 |
|
H6446 |
SILVERSUMMIT HEALTHPLAN, INC. |
Centene Corporation |
Part C or D |
3,343 |
|
H7175 |
WELLCARE HEALTH INSURANCE OF NORTH CAROLINA, INC. |
Centene Corporation |
Part C |
9.062 |
|
H7330 |
ZING HEALTH, INC. |
Zing Health Consolidator, Inc |
Part D |
2,215 |
|
S6946 |
CLEAR SPRING HEALTH INSURANCE COMPANY |
Group 1001 |
Part D |
454,820 |
[1] See CY 2020 and 2021 final rule (CMS-4185-F) at https://www.federalregister.gov/documents/2019/04/16/2019-06822/medicare-and-medicaid-programs-policy-and-technical-changes-to-the-medicare-advantage-medicare. See also the Announcement of Calendar Year (CY) 2022 Medicare Advantage (MA) Capitation Rates and Part C and Part D Payment Policies, page 97 at https://www.cms.gov/files/document/2022-announcement.pdf.
[2] See CY 2024 final rule (CMS-4201-F) at https://www.federalregister.gov/documents/2023/04/12/2023-07115/medicare-program-contract-year-2024-policy-and-technical-changes-to-the-medicare-advantage-program.
[3] See CY 2022 final rule (CMS-4190-F2) at https://www.federalregister.gov/documents/2021/01/19/2021-00538/medicare-and-medicaid-programs-contract-year-2022-policy-and-technical-changes-to-the-medicare.
[4] See also the Announcement of Calendar Year (CY) 2024 Medicare Advantage (MA) Capitation Rates and Part C and Part D Payment Policies, page 145 at https://www.cms.gov/files/document/2024-announcement-pdf.pdf.
[5] See CY 2021 final rule (CMS-4190-F) at https://www.federalregister.gov/documents/2020/06/02/2020-11342/medicare-program-contract-year-2021-policy-and-technical-changes-to-the-medicare-advantage-program; and December 19, 2022, HPMS Memorandum “Part C and D Star Ratings Tukey Outlier Deletion Simulations”
[6] See CY 2022 final rule (CMS-4190-F2) at https://www.federalregister.gov/documents/2021/01/19/2021-00538/medicare-and-medicaid-programs-contract-year-2022-policy-and-technical-changes-to-the-medicare.
[7] Percentages in the tables may not sum to 100 due to rounding.
[8] 42 C.F.R. §§ 422.166(h)(1)(i), 423.186(h)(1(i).
[9] 42 C.F.R. §§ 422.166(h)(1)(ii), 423.186(h)(1)(ii).
[10] The qualifying extreme and uncontrollable circumstances for the 2022 performance period include New Mexico wildfires, Kentucky severe storms, Hurricane Fiona, and Hurricane Ian. See 2024 Rate Announcement at https://www.cms.gov/files/document/2024-announcement-pdf.pdf.