Medicare Part D – Direct and Indirect Remuneration (DIR)
Under Medicare Part D, Medicare makes partially capitated payments to private insurers, also known as Part D sponsors, for delivering prescription drug benefits to Medicare beneficiaries. Medicare relies on transaction data reported by Part D sponsors to make sure these payments are accurate. Often, the Part D sponsor or its pharmacy benefits manager (PBM) receives additional compensation after the point-of-sale that serves to change the final cost of the drug for the payer, or the price paid to the pharmacy for the drug. Examples of such compensation include rebates provided by manufacturers and concessions paid by pharmacies. Under Medicare Part D, this post point-of-sale compensation is called Direct and Indirect Remuneration (DIR) and is factored into CMS’s calculation of final Medicare payments to Part D plans.
Total DIR reported by Part D sponsors has been growing significantly in recent years. Part D sponsors and PBMs are engaging to a greater extent in arrangements that feature compensation after the point-of-sale, and the value of such compensation is also generally increasing. As a result, CMS has observed a growing disparity between gross Part D drug costs, calculated based on costs of drugs at the point-of-sale, and net Part D drug costs, which account for all DIR.
This trend has significant implications for Medicare Part D:
- Beneficiary Cost-Sharing: Beneficiaries’ cost-sharing is calculated based on the drug price at the point-of-sale, without regard to rebates and other price concessions received after the point-of-sale. Therefore, while DIR may hold down total program expenses (and beneficiary premiums), it does not reduce the cost of drugs for beneficiaries at the point-of-sale.
- Medicare Subsidy Payments: Medicare pays the Part D cost-sharing obligations on behalf of millions of low income Medicare beneficiaries (12 million in 2015), many of whom are dually eligible for Medicare and Medicaid. As the growth of rebates and other price concessions places more of the burden on beneficiary cost-sharing, Medicare’s costs for these beneficiaries also grow. Higher beneficiary cost-sharing also results in the quicker progression of Part D enrollees through the Part D drug benefit phases and potentially leads to higher costs in the catastrophic phase, where Medicare liability is generally around 80 percent.
- Plan Liability: The growing use of rebates and other price concessions has contributed to an important shift in how Part D spending is distributed across the final three phases of the part D benefit: the initial coverage phase, the coverage gap, and the catastrophic phase. High priced drugs, now increasingly packaged with high rebates, shift more and more of the drug spend into the catastrophic phase. In the catastrophic phase, Part D plans are responsible for only 15 percent of costs. Moreover, under current Part D rules, the largest share of all rebates and other price concessions is allocated to reduce plan liability, and, therefore, the high price-high DIR trend has a disproportionate impact on plan liability. In other words, Part D sponsors, who control drug spending for Medicare, are, in fact, responsible for only a share of Part D drug spending, and, as a result of the increasing preference for high price-high DIR arrangements, that proportion is shrinking each year. This also explains why Part D premiums, which are based, in large part, on plan liability, have grown only modestly in comparison to gross drug costs.
Medicare Part D Payment
Medicare’s payments to Part D sponsors are largely determined through an annual bidding process. A plan’s bid reflects its estimate of the revenue needed to provide beneficiaries with the Medicare prescription drug benefit. Following the close of the payment year, CMS reconciles each plan’s bid-based prospective payments based on its actual experience, either reclaiming some funds or making additional payments.
a. Point-of-Sale Price
The Part D reconciliation process, in particular, is dependent on transaction data summarized on Prescription Drug Event (PDE) records. The Part D sponsor submits a PDE record to CMS for each transaction in which a beneficiary obtains a prescription drug. The transaction record includes a price, which quantifies the amount paid to the pharmacy that dispenses the drug. The price reported on the PDE record as paid to the pharmacy at the point-of-sale is used to calculate beneficiary cost-sharing and, more broadly, to adjudicate the Part D benefit as it is the primary basis for determining plan, beneficiary, and government liability.[1]
b. Direct and Indirect Remuneration (DIR)
Fees, payments, or payment adjustments made after the point-of-sale that change the cost of Part D covered drugs for Part D sponsors or PBMs must be reported to CMS as Direct or Indirect Remuneration (DIR). DIR results from payment arrangements negotiated independent of CMS, between Part D sponsors, PBMs, network pharmacies, drug manufacturers, and other parties involved in the administration of the Part D benefit. Manufacturer rebates comprise a significant share of all DIR reported to CMS.
The final plan payments by CMS are, per statute, to be based on the costs actually incurred by Part D sponsors. These actual costs must reflect any applicable DIR. DIR is apportioned only between Medicare and the Part D plan, generally based on the share of the total Part D drug costs that each is responsible for over the course of the payment year.
Sponsors must also factor into their plan bids an estimate of the DIR expected to be generated. Higher DIR leads to lower bids and, therefore, puts downward pressure on beneficiary premiums.
Recent Trends in DIR
In recent years, CMS has observed a notable growth in DIR collected and reported by Part D sponsors. Figures 1 and 2 below provide a general overview of this trend.
Figure 1 – DIR by Payment Year
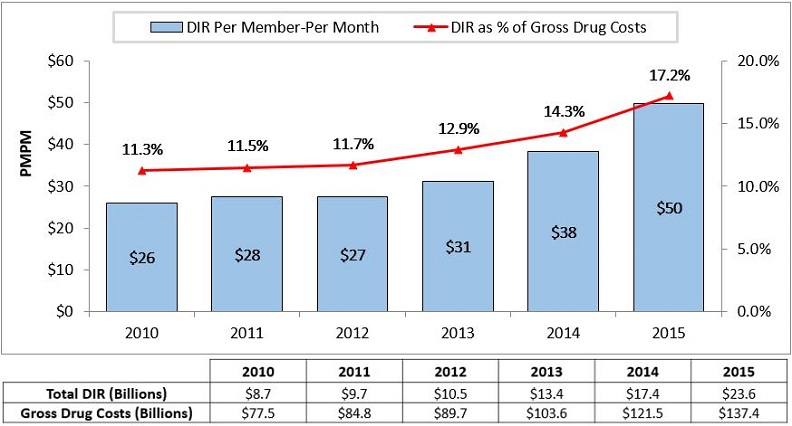
Source: Analysis of DIR and enrollment data from the 2016 Annual Report of the Boards of Trustees of the Federal Hospital Insurance and Federal Supplemental Medical Insurance Trust Funds (CY 2016 Medicare Trustee’s Report) and cost data from PDE records.
Figure 2 – Net Drug Costs
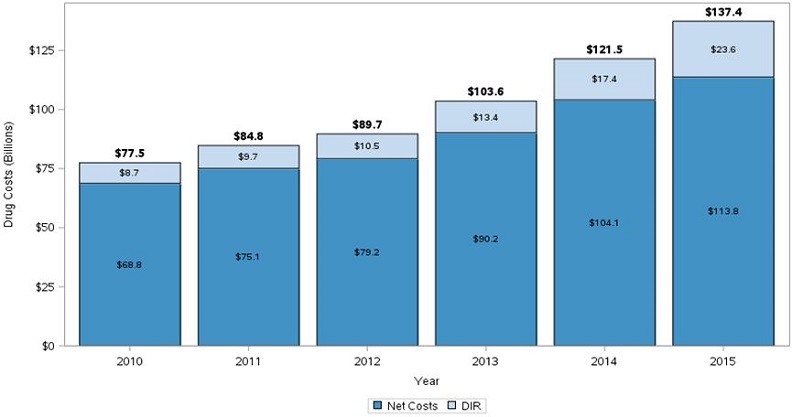
Source: Analysis of DIR data from the CY 2016 Medicare Trustee’s Report and cost data from PDE records.
Since 2010, the growth in DIR has far outpaced the growth in Part D drug costs, on both a total and a per-member per-month (PMPM) basis. CMS observed total DIR grow about 22 percent per year and PMPM DIR grow nearly 14 percent per year between 2010 and 2015. During the same period, total Part D gross drug costs only grew about 12 percent per year and PMPM Part D gross drug costs only grew nearly 5 percent per year. Gross drug costs and DIR have grown most dramatically since 2013.
Figure 3 below illustrates the impact of DIR on plan and government liability under Part D for every year between 2010 and 2015.
Figure 3 – Final Annual Medicare Reinsurance and Plan Liability per Beneficiary[2]
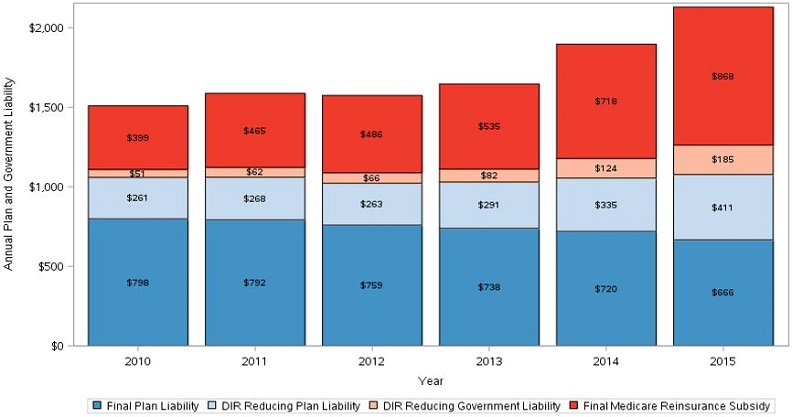
Sources: Analysis of DIR, reinsurance subsidy, and enrollment data from the CY 2016 Medicare Trustee’s Report and cost data from PDE records.
Despite the growth in total gross drug costs, the relatively faster growth in DIR has resulted in a steady decline in final plan liability (represented by the darker blue portion in the figure above). Between 2010 and 2015, final annual plan liability per beneficiary declined nearly 5 percent per year. Beneficiary premiums and the Medicare direct subsidy, together, cover plan liability; the chart above displays plan liability before accounting for these plan revenues. During the same period, the Medicare reinsurance subsidy on a per member-per year basis has grown at an annual rate of nearly 17 percent. The last trend is partially the result of the fact that in the more recent years of our analysis, when the growth in the reinsurance subsidy is most pronounced, Part D gross drug cost growth is concentrated in the catastrophic phase of the Part D benefit, where Medicare covers 80 percent of drug costs.
Figure 4 below illustrates how the final plan liability compares to the Part D beneficiary premium. Payment arrangements that result in post point-of-sale concessions lessen plan liability and put downward pressure on beneficiary premiums. This pressure is one reason that premiums remained relatively unchanged between 2010 and 2015, despite the fact that total gross drug costs grew about 12 percent per year in that span.
Figure 4 – Final Annual Plan Liability and Average Basic Premium per Beneficiary[3]
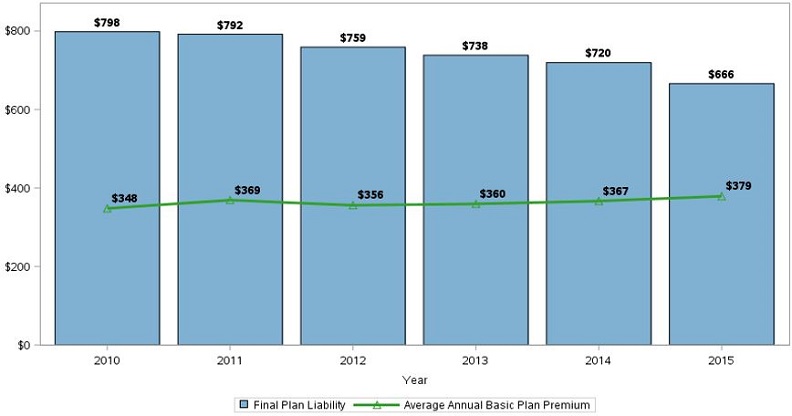
Source: Analysis of DIR and enrollment data from the CY 2016 Medicare Trustee’s Report and CMS released premium information.
Impacts of Recent Trends
Higher levels of DIR generally mean a greater difference between the price assessed at the point-of-sale and the actual financial obligation of the Part D sponsor. The cost of rebates and other price concessions received after the point-of-sale is built into the list price charged at the point-of-sale.
Higher prices for drugs and higher DIR can impact the benefit in a number of ways.
a. Higher Out-of-Pocket Spending
Higher point-of-sale prices generally result in higher beneficiary cost-sharing obligations as cost-sharing is often assessed as a percentage of the list price. For example: if a beneficiary’s cost-sharing obligation is 10 percent out-of-pocket, a beneficiary will need to pay $10 for a drug with a list price of $100, as opposed to $5 for a drug with a list price of $50.
Moreover, the list prices also play an important role in a beneficiary’s progression through the different phases of the Part D benefit; higher list prices mean quicker progression through the benefit and higher overall costs in the catastrophic phase once the beneficiary reaches it. Rebates and other price concessions received after the point-of-sale do not mitigate these impacts.
b. Moderated Premiums
Higher levels of DIR can reduce beneficiary premiums and some government costs. Under the Part D payment rules, rebates and price concessions received after the point-of-sale are factored into the calculation of beneficiary premiums and Medicare’s direct subsidy payments to Part D sponsors. As a result, a higher level of DIR places downward pressure on beneficiary premiums and the government’s plan payment obligations that subsidize premiums. While rebates and other post point-of-sale price concessions are also factored into the calculation of Medicare’s reinsurance subsidy, the growth of gross costs in the catastrophic phase of the benefit has outpaced growth in DIR, resulting in increased reinsurance costs incurred in the catastrophic phase by the government.
The net effects of these trends on costs for beneficiaries and the government are still unclear.
c. Lower Levels of Liability for Plans
As mentioned earlier and illustrated by figure 3 above, higher levels of DIR also have the impact of moderating the financial liability of Part D plans, counteracting the overall growth of Part D drug spending. High cost-high DIR arrangements ease the financial burden borne by Part D plans essentially by shifting costs to the catastrophic phase of the benefit, where plan liability is limited.
Additional Resources
Medicare Drug Spending Dashboard
CMS makes information available about the prices of certain drugs in Medicare Part D, including some limited rebate data:
The Medicare Part D Benefit
The Medicare Payment Advisory Commission (MedPAC) provides a summary of Medicare Part D payment rules:
Methodology Notes
DIR information is available from table IV.B8 of the CY 2016 Medicare Trustee’s Report. The Trustee’s Report presents the information as a percentage of total gross drug costs. The percentage is inclusive of rebates and other non-rebate forms of DIR for brand name and generic drugs, which explains why the DIR data presented in this fact sheet will not match the rebate information in the Manufacturer Rebate Summary Report released by CMS in 2016 with the Medicare Drug Spending Dashboard.
Enrollment information is available from table IV.B7 of the CY 2016 Medicare Trustee’s Report. The Part D enrollment figures used for the analysis presented in this document are not inclusive of retiree drug subsidy enrollment.
Reinsurance subsidy information is available from table IV.B9 of the CY 2016 Medicare Trustee’s Report.
The share of DIR allocated to reduce plan liability and Medicare’s reinsurance subsidy obligation is based on the allocation methodology outlined in the Advance Notice of Methodological Changes for Calendar Year (CY) 2006 Medicare Advantage (MA) Payment Rates.
Part D premium information is available from the Part D benchmark rollout materials.
Part D drug cost information—including the gross drug cost, LICS, and plan liability amount for each year—is available from the Part D PDE data. Gross drug cost represents total spending, including Medicare, plan, and beneficiary payments, and is equal to the sum of the following fields of the PDE record: covered plan paid amount, not covered plan paid amount, patient pay, patient liability reduced by other, other true out-of-pocket costs, LICS, and gap discount amount. Plan liability is equal to the covered plan paid amount field of the PDE minus the sum of the total reinsurance subsidy amount and the total DIR amount, both of which can be found in the CY 2016 Medicare Trustee’s Report. PDE data used for this analysis was current as of January 9th, 2017.[4]
The annual growth rates presented in this document are compound annual growth rates.
Values may not add due to rounding.
###
Get CMS news at cms.gov/newsroom, sign up for CMS news via email and follow CMS on Twitter @CMSgovPress
[1] For more information about the Part D benefit structure, reference the CY2017 Rate Announcement located here: https://www.cms.gov/Medicare/Health-Plans/MedicareAdvtgSpecRateStats/Announcements-and-Documents.html.
[2] The final plan liability presented here is not adjusted for risk sharing reconciliation, through which Medicare recoups some excess plan profits or shares the burden of excess plan losses.
[3] See footnote 2.
[4] For more information regarding the PDE record fields, reference the 2011 PDE Participant Guide located here: http://www.csscoperations.com/internet/cssc3.nsf/DocsCat/CSSC~CSSC%20Operations~Prescription%20Drug%20Event~Training~Prescription%20Drug%20Event~8LAP7A1257?open&navmenu=Prescription^Drug^Event.