QASP Beneficiary Customer Service
What is measured?
The various Beneficiary Customer Service standards measure the contractors timely and accurate handling of congressional and beneficiary inquires as well as Next Generation Desktop acceptance and tracking.
Performance Data
|
Fiscal Year |
Average QASP Score |
Low |
Median |
High |
|---|---|---|---|---|
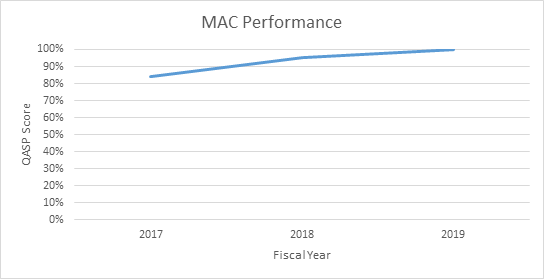
| 2017 | 84% | 60% | 85% | 100% |
| 2018 | 95% | 70% | 100% | 100% |
| 2019 | 100% | 100% | 100% | 100% |

Trends and Observations
An overall positive trend can be observed from Fiscal Year 2017 – 2019. Specifically, there has been an overall increase of 16 percentage points (19% increase) as well as an increase, every year, in the lowest score. Every year at least one MAC was in 100% compliance.
Page Last Modified:
09/10/2024 06:08 PM