Award Fee MRN Timeliness
What is measured?
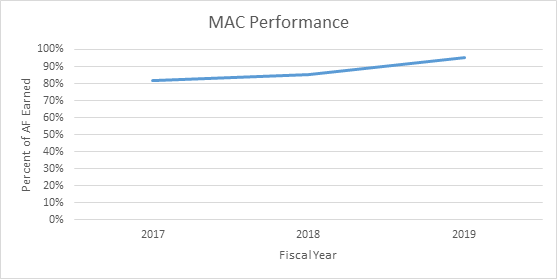
This table and graph depict the average, lowest, median, and highest MAC percentage of award fee earned for processing redeterminations in accordance with statutorily mandated timeframes. The score represents the percentage of months the MAC conformed with the CMS threshold outlined in the Award Fee Plan for the given year.
Performance Data
|
Fiscal Year |
Average Overall Percentage of Award Fee Earned for Processing Redeterminations Timely |
Low |
Median |
High |
|
2017 |
82% |
38% |
84% |
100% |
|
2018 |
85% |
67% |
84% |
96% |
|
2019 |
95% | 82% | 96% | 100% |
Trends and Observations
An overall positive trend can be observed from Fiscal Year 2017 – 2019. Specifically, there has been an increase in performance each year and an overall increase of 13 percentage points (16 percent increase) since 2017. There has also been a substantial increase in the lowest score during the period.