QASP Claims Processing
What is measured?
The Claims Processing QASP standards measure clean claims processing timeliness and Medicare Summary Notice (MSN) management.
Performance Data
|
Fiscal Year |
Average QASP Score |
Low |
Median |
High |
|---|---|---|---|---|
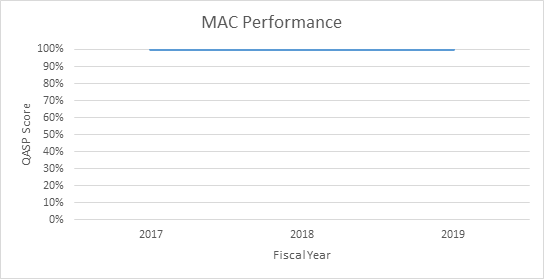
| 2017 | 100% | 100% | 100% | 100% |
| 2018 | 100% | 100% | 100% | 100% |
| 2019 | 100% | 100% | 100% | 100% |
Trends and Observations
An overall sustained trend can be observed from Fiscal Year 2017 – 2019. The MACs have performed very well every year. It is important to note that the MACs have consistently scored higher on Claims Processing metrics compared to the other business functions measured by QASP and in 2017, 2018, and 2019 all MACs were in 100% conformance.
Page Last Modified:
03/10/2026 08:33 PM